 Feb 18, 2026
Engineering
How to Use AI for Content Creation Without Losing Your Voice
Practical tips for leveraging AI tools to speed up content creation while maintaining your unique brand voice.
Read More
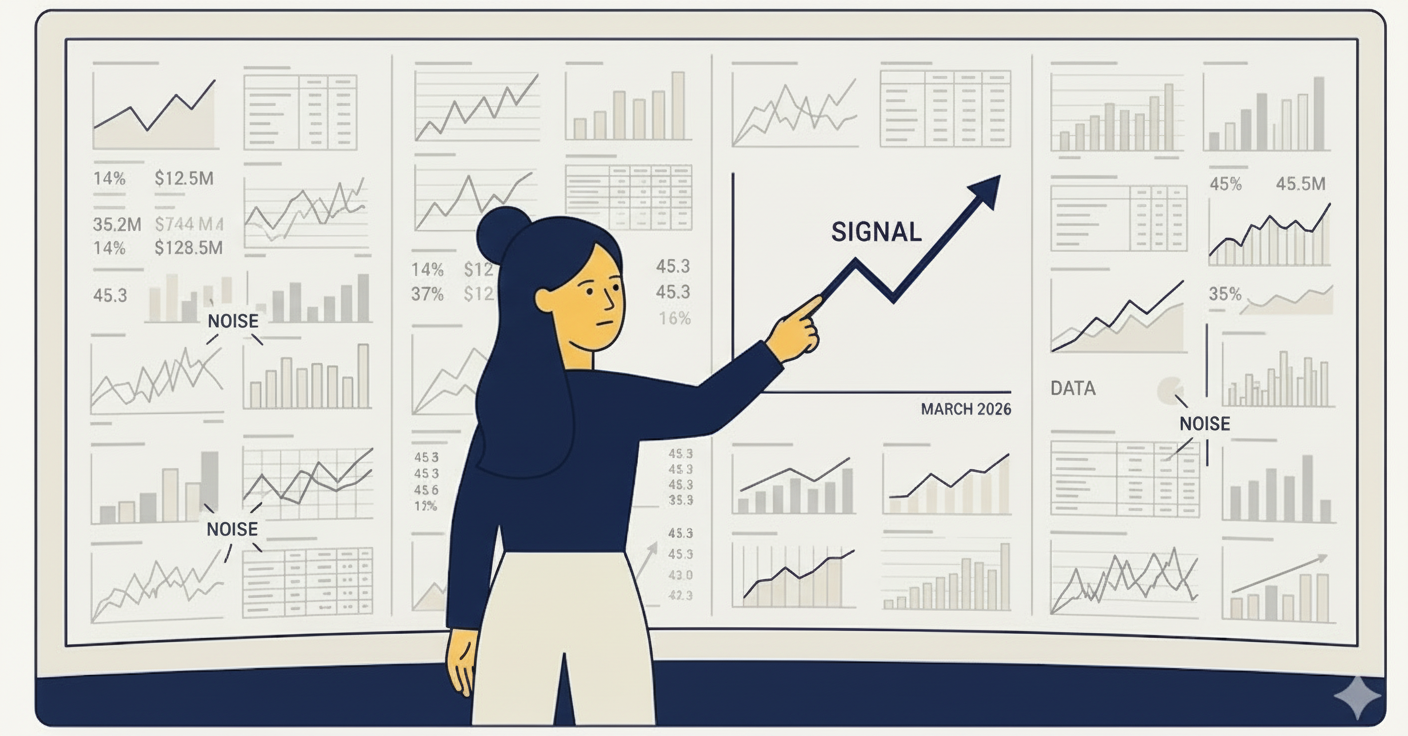
Most social media managers track too many metrics — or the wrong ones entirely. Follower counts, total likes, and impressions can look impressive in a report but tell you very little about whether your strategy is actually working. The metrics that matter are the ones tied to real business outcomes: engagement quality, traffic, conversions, and growth rate.
In this guide, we'll cut through the noise and help you build a focused analytics dashboard that tracks what actually moves the needle.
It's easy to get caught up in follower counts and likes. But do these numbers actually move the needle for your business?
Vanity metrics are numbers that look good on paper but don't correlate with business results:
The danger of vanity metrics is that they give you a false sense of progress. You might celebrate hitting 10,000 followers while your actual engagement rate is declining. Meanwhile, a creator with 2,000 highly engaged followers is generating more leads and revenue.
Not just total engagement, but engagement rate relative to your audience size. This is the single best indicator of content quality and audience connection.
Formula: (Likes + Comments + Shares + Saves) / Followers × 100
Benchmarks by platform:
A smaller account with 5% engagement consistently outperforms a large account with 0.5% — both in algorithmic reach and business outcomes.
How many people actually click your links? CTR measures whether your content is compelling enough to drive action beyond the platform.
Formula: Link Clicks / Impressions × 100
If your CTR is low, your call-to-action might be weak, your content might not build enough curiosity, or you might be targeting the wrong audience. Test different CTA formats and track which ones drive the most clicks.
Of those who clicked, how many took the desired action — signing up, purchasing, downloading, or subscribing?
Formula: Conversions / Link Clicks × 100
This is where social media meets business results. A high CTR with a low conversion rate suggests your landing page or offer needs work, not your social content.
How much of the conversation in your industry are you capturing compared to competitors? Track brand mentions, tagged posts, and relevant keyword conversations to understand your visibility.
How to measure:
Not total followers, but the rate of growth over time. This tells you whether your content strategy is attracting new people consistently.
Formula: New Followers in Period / Total Followers at Start × 100
A steady 5% monthly growth rate is more sustainable and valuable than a viral spike followed by a plateau.
Different business goals require different metrics. Here's how to align your tracking with your objectives:
The key is focus. Track 5-7 key metrics that align with your current primary goal — not 30 metrics that dilute your attention.
Weekly review: Spend 15 minutes every Monday reviewing your numbers. Look for:
Monthly review: Take 30-60 minutes at month's end for strategic analysis:
Quarterly review: Zoom out and evaluate your strategy:
Most platforms offer built-in analytics, but they only show data for that single platform. For a cross-platform view, you need a unified dashboard.
When scheduling your content with a tool like Shaflex, you can see how your posts perform across Threads, X, BlueSky, Mastodon, and LinkedIn — all in one place. This makes it much easier to spot cross-platform patterns and optimize your strategy holistically.
Stop chasing vanity metrics. Define what success looks like for your brand, pick 5-7 metrics that align with those goals, and use that data to continuously improve your strategy.
The best social media strategies are built on feedback loops: create content, measure results, learn, and iterate. Start with your engagement rate and CTR — these two metrics alone will tell you more about your content's effectiveness than any follower count ever could.
Ready to track your performance across all platforms? Try Shaflex for free and see how your content performs everywhere you publish.
Feb 18, 2026Practical tips for leveraging AI tools to speed up content creation while maintaining your unique brand voice.
 Feb 10, 2026
Expert strategies to grow your LinkedIn following and generate quality leads for your B2B business.
 Jan 15, 2026
Learn how to effectively schedule your social media content to maximize engagement and reach your audience at the right time.